7 BTO Willow Tit data
In December 2024, the British Trust for Ornithology (BTO) released their Breeding Bird Survey (BBS) dataset (https://zenodo.org/records/14161736) containing data collected between 1994 - 2023.
As an addendum to this project, I explored the BBS Willow Tit data. The code for processing and visualising the BTO BBS data be found in the file BBSWillowTit.R.
It is important to note that BBS collection methodology, as well as the data collected, are very different from eBird. BBS use a standard protocol which attempts to reduce biases as well as quality check data at the point of collection. Therefore, the data preparation and analysis with R cannot be fully comparable to those from the eBird analysis.
I chose to explore all 30 years of the available data to see what insights I could glean about Willow Tits. One reason for this is that eBird is a relatively new dataset, having been launched in 2002. Although users are adding their historical checklists, these data are not always complete or can be included, meaning a longitudinal study not always possible. This is why it can be useful to see both these datasets as part of the bigger picture.
7.1 A quick note on BBS methodology
Data collected as part of the BBS follows a strict protocol. A 1x1km grid square is surveyed. Two visits are performed during the breeding season: an early visit, between April and mid May, and a late visit, between mid May and June. For each visit, observers record the number of individuals along two 1km transects. Each transect is subdivided into 200m-long sections and observations are recorded at four distance bands: <25m, 25-100m, >100m, in flight at a distance.
See the accompanying BBS paper https://onlinelibrary.wiley.com/doi/10.1111/geb.13943 for more detailed methodology and discussion.
7.2 Exploration of results
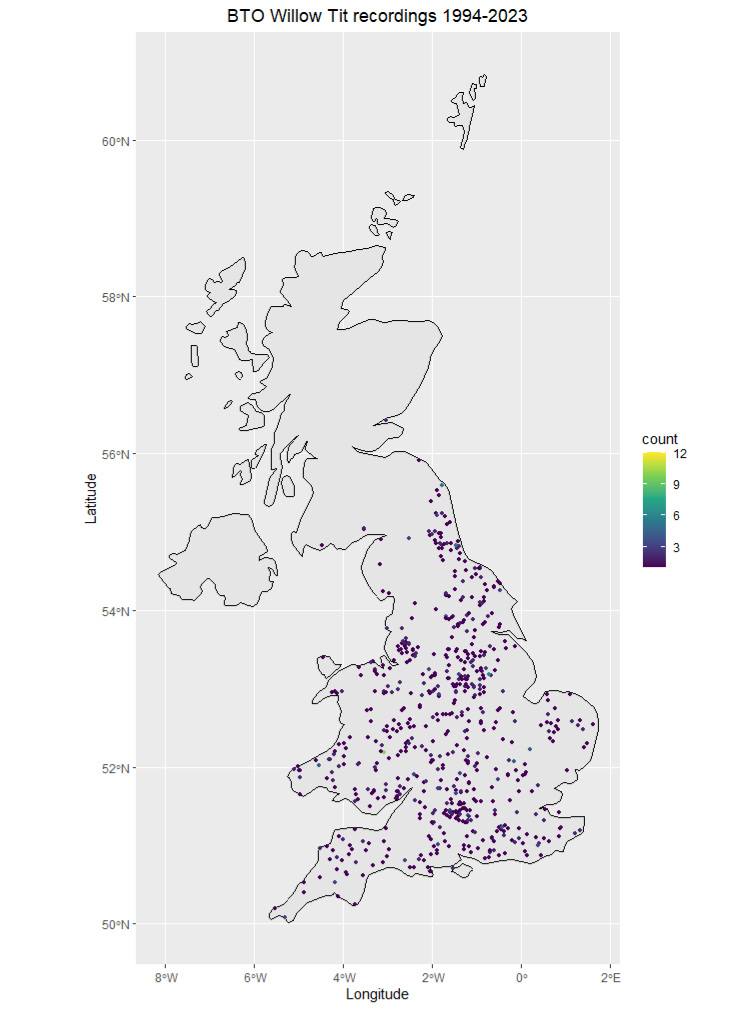
Between 1994-2023, there were 1479 Willow Tit observations across 614 unique sites (i.e. 1x1km grid squares). 327 of these sites were only surveyed once. This would presumably be due to the BBS methodology of randomly allocating grid squares.
The sightings were then plotted on a map of the UK:
Data were then grouped by the year and site. To avoid adding the counts of early and late visits, the highest count across both was used to get an estimated total of 2035 Willow Tit observations over the 30 years.
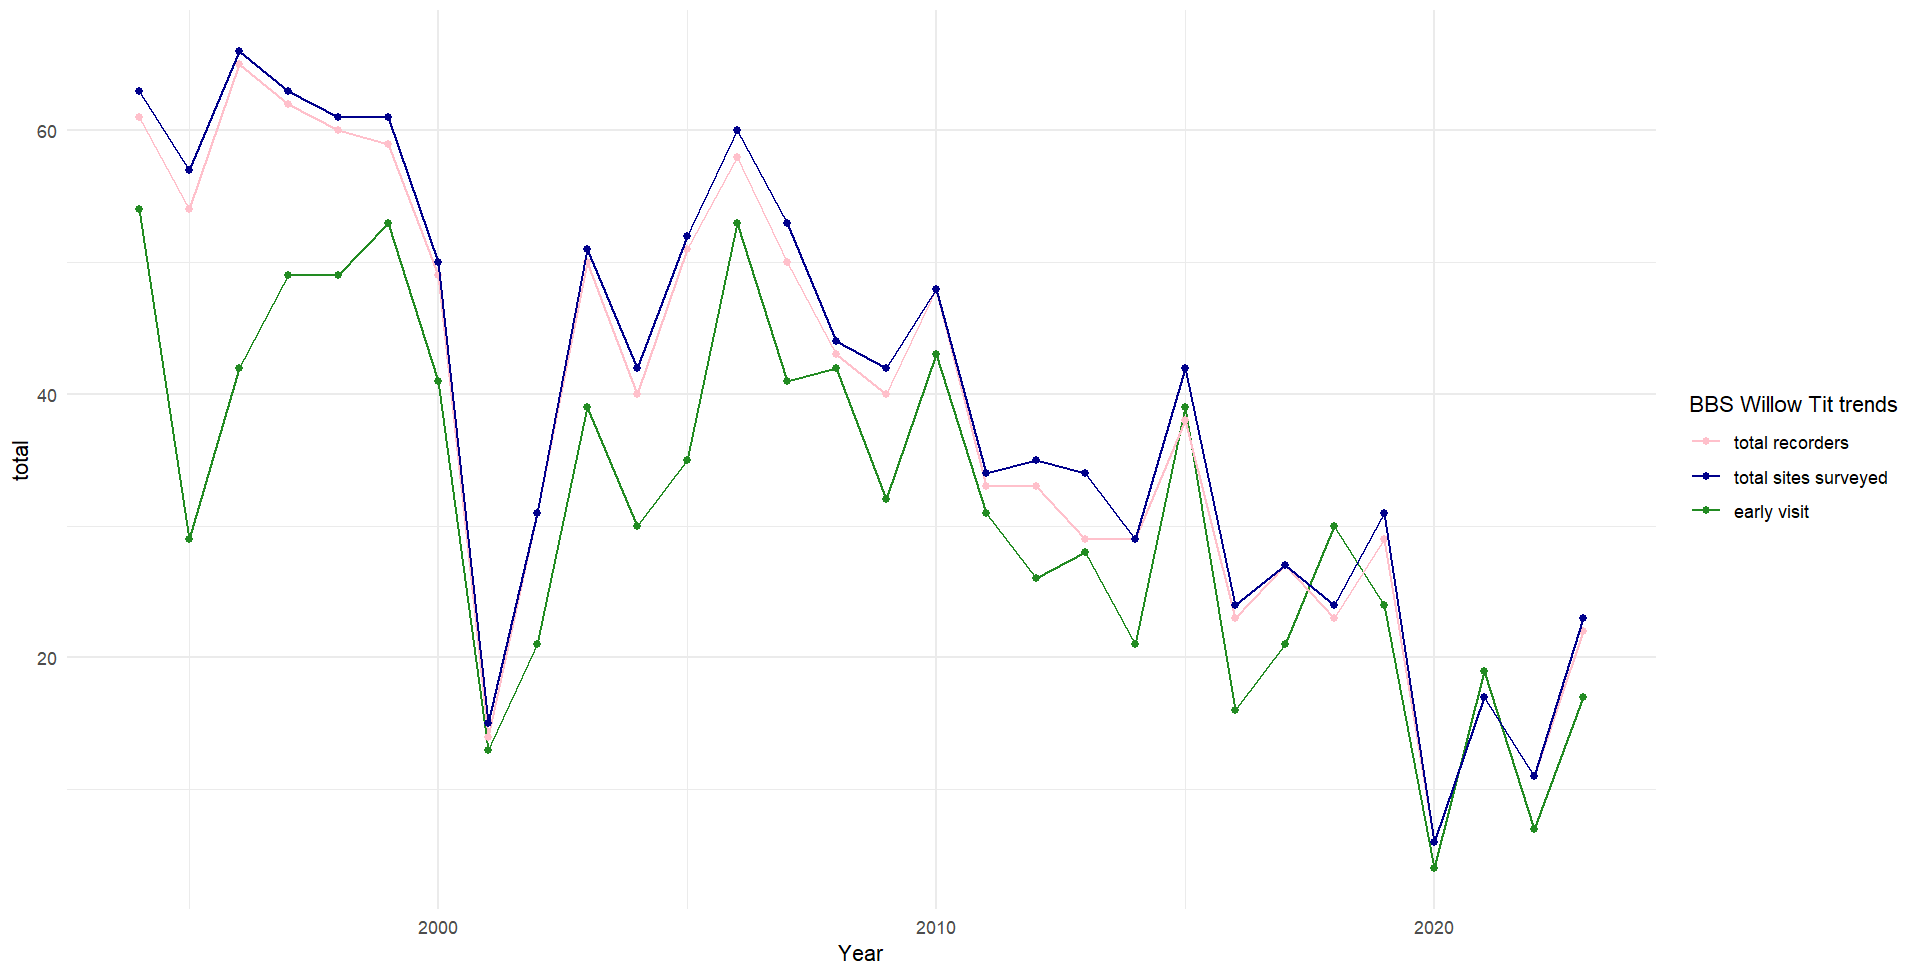
High count totals for each year were then plotted to look at trends:
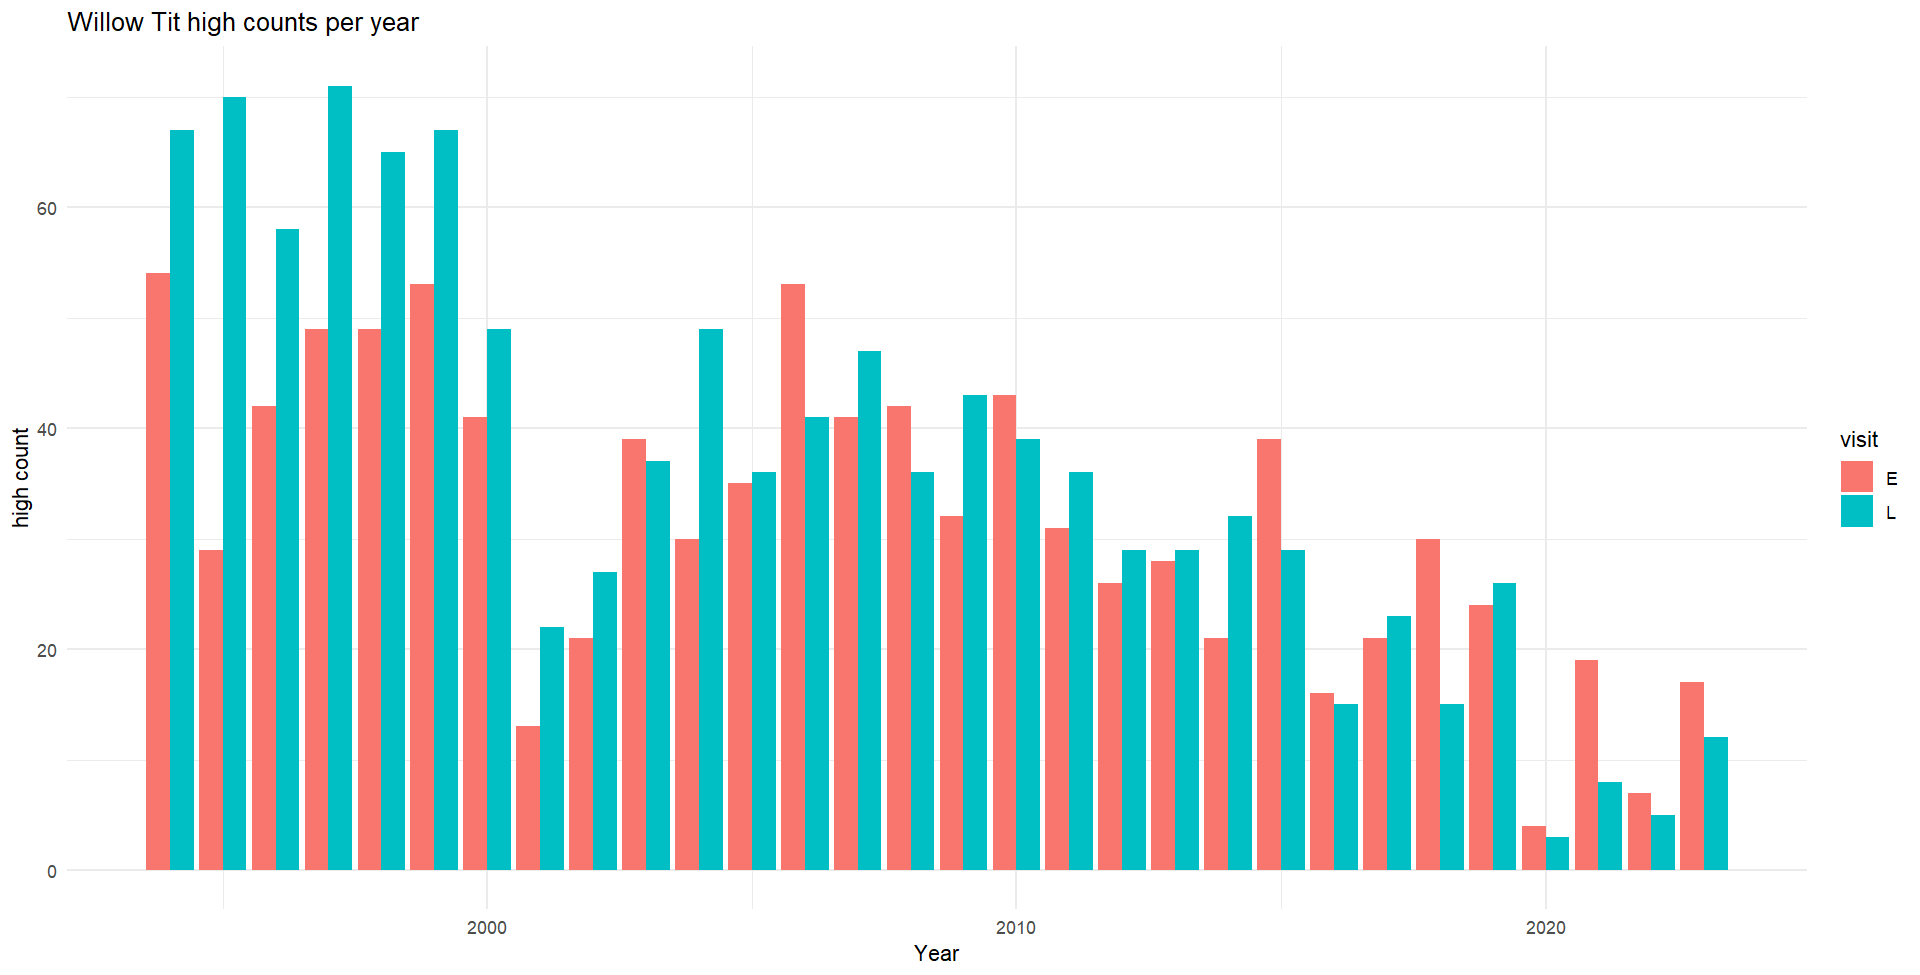
It appears that Willow Tit observations were historically more likely later in the breeding season between mid May and June, with more recent years having higher rates of observations earlier between April and mid May.
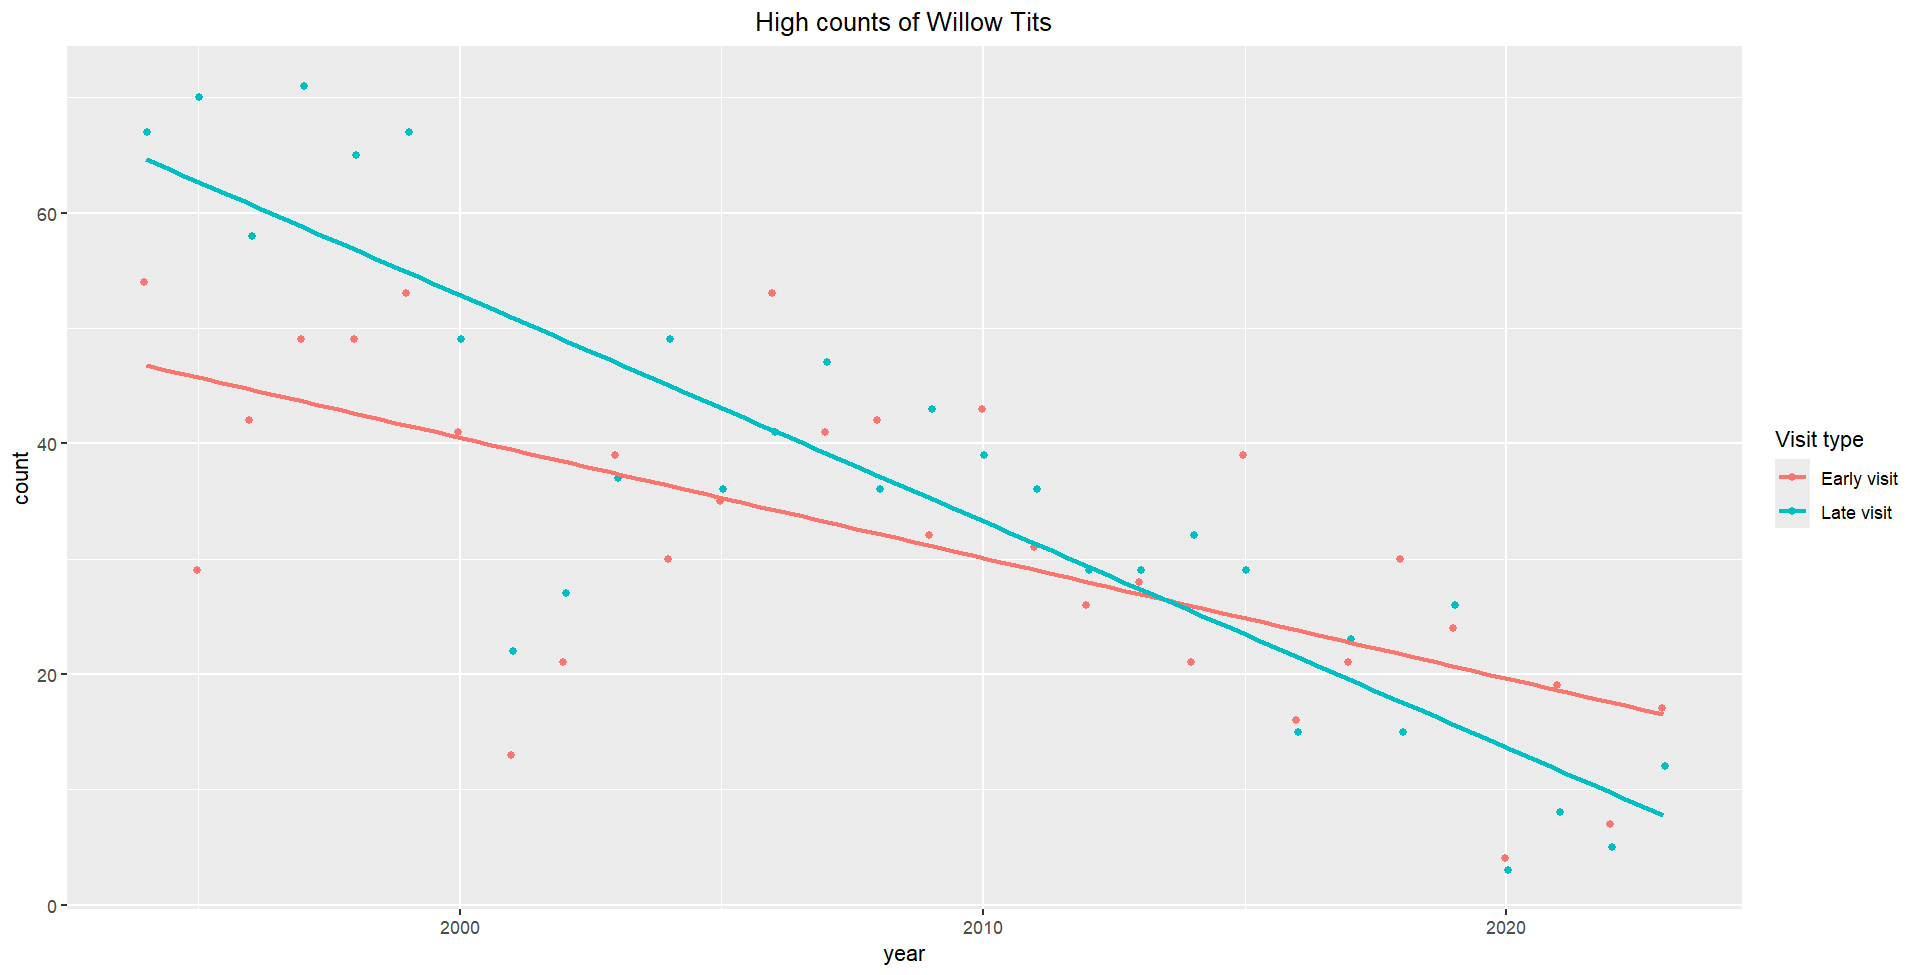
The affect of the Covid pandemic on recording during 2020 can be seen, but overall, there is a decrease in numbers of Willow Tits as shown by adding regression lines:
However, this is not evidence of a population decline as such when compared to the number of sites surveyed each year:
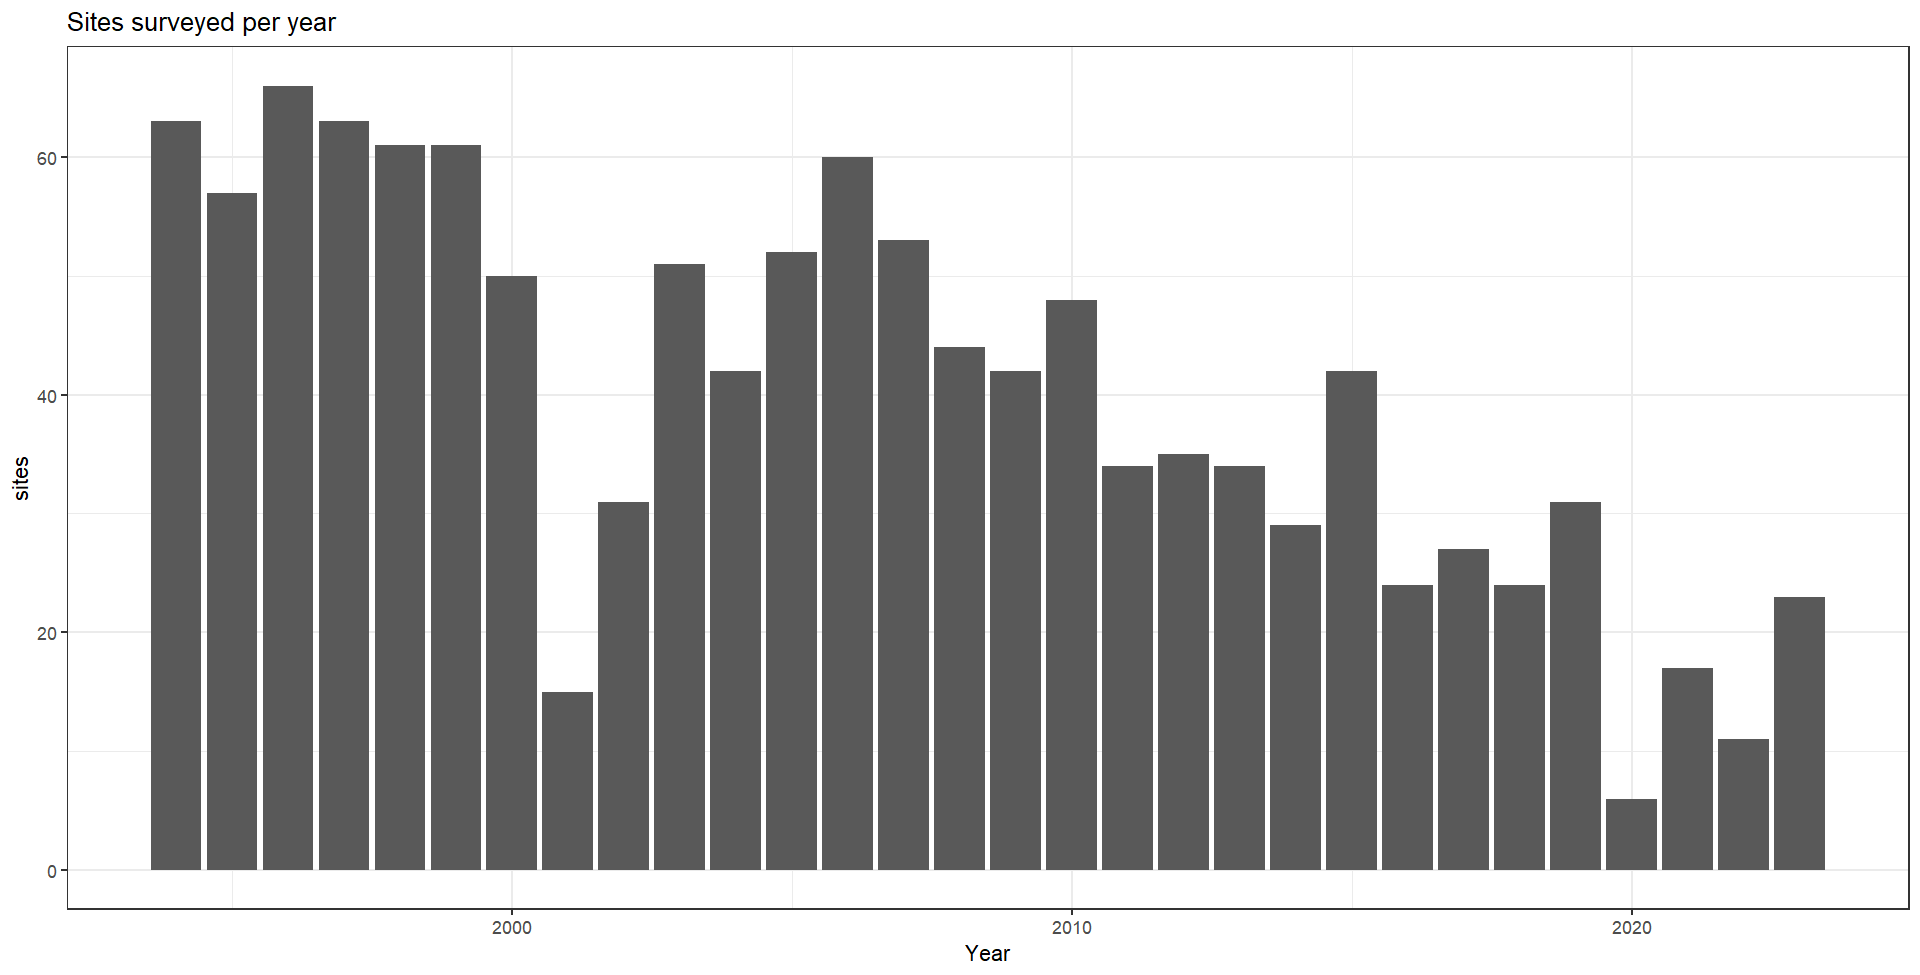
There seems to be a correlation here, that is, the more sites surveyed, the more likely a Willow Tit will be detected. Considering only 0.02% of the total BBS checklists contained Willow Tit observations, this is very likely.
This conclusion felt a little similar to the conclusion from the eBird data that the longer the visit, the more chance of observation. I therefore, plotted the total number of sightings against the total number of sites per year for both BBS and eBird data, note I only used early visit totals for the BBS data:
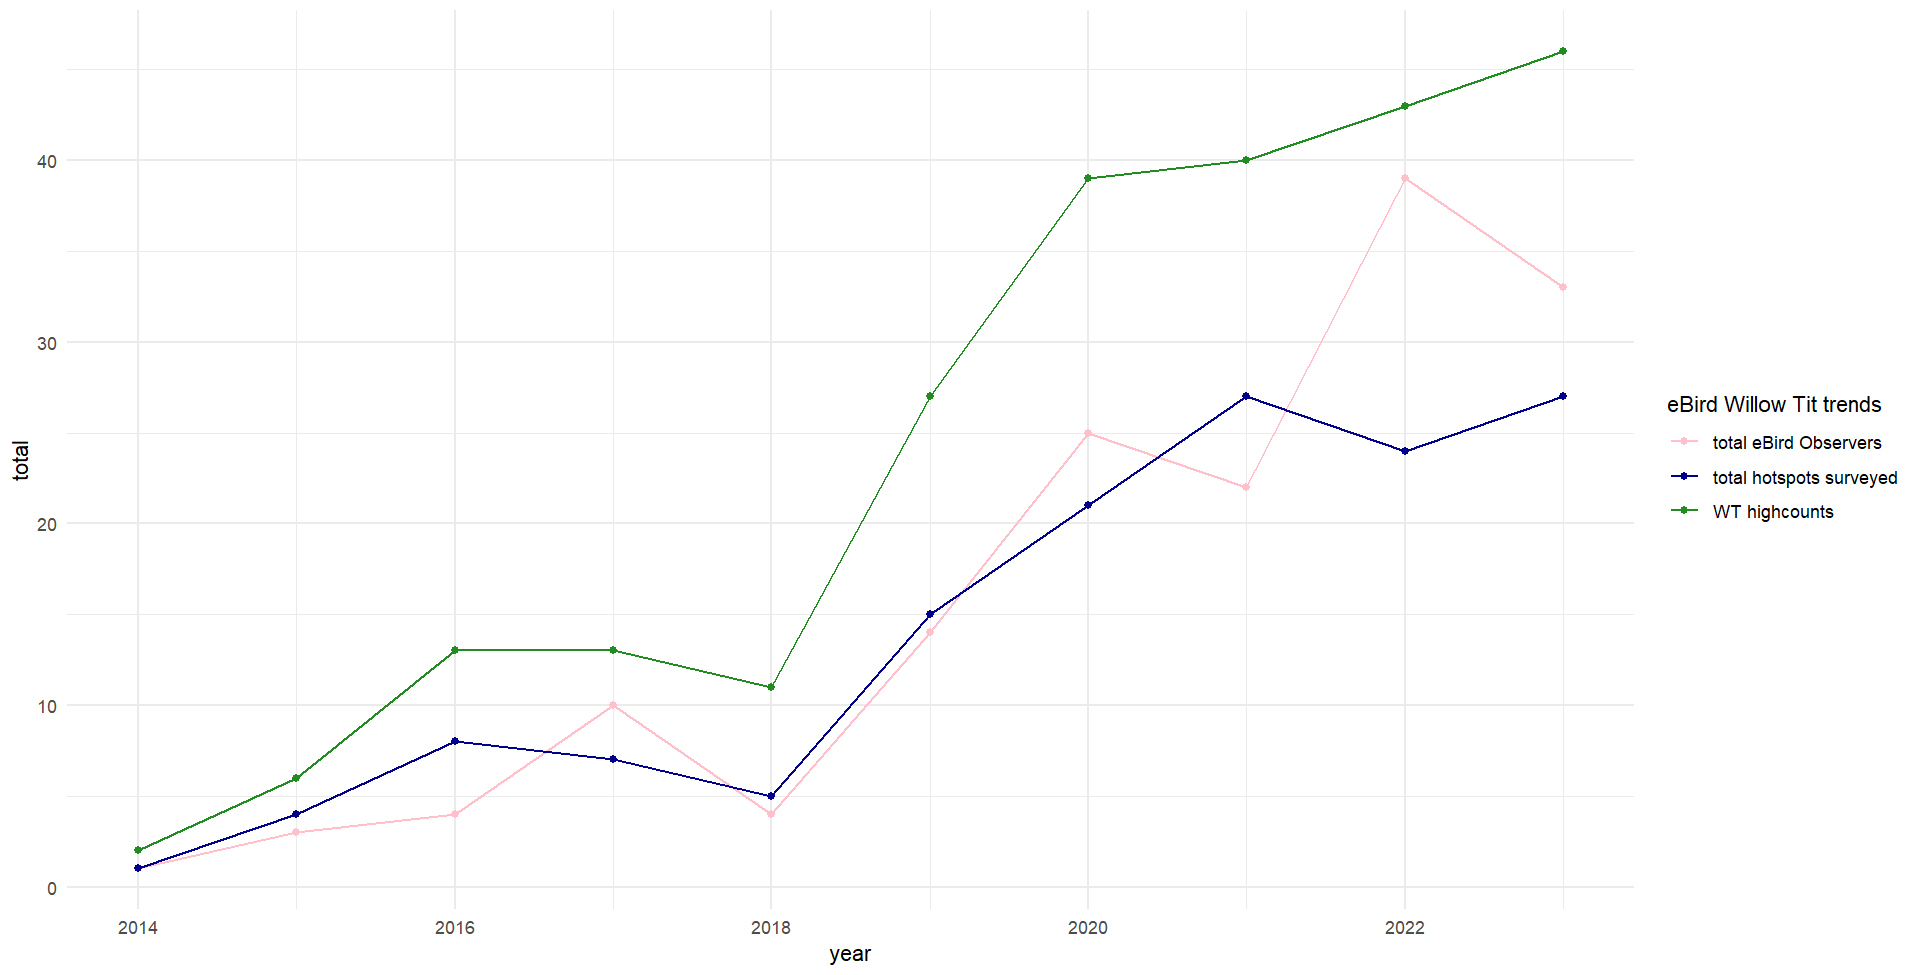
As discussed earlier, eBird data is not showing an increase in Willow Tit populations, rather it is more likely that increased popularity and use of eBird has meant more ebirders are recording and more data are being entered. However, what is very clear, are the correlations between the number of observers, the number of sites surveyed, and the number of Willow Tits observed.
Based on this alone, it is not possible to say anything about the status of the population of the species.
7.3 Statistical analysis: BBS and eBird data
I decided to run a correlation analysis on both the BBS and eBird datasets to understand more fully the relationship between variables: Willow Tit counts and number of sites surveyed.
I chose to run the following R code for a Kendall’s correlation test as the data do not follow a normal distribution:
cor(data$total, data$sites, method = "kendall")7.3.1 Results:
| Data set | Kendall | Discussion |
|---|---|---|
| BBS | 0.7600216 | Indicates a strong positive positive association between the two variables: count and sites |
| eBird | 0.8863636 | Indicates a strong positive association between the two variables: count and sites |
I also ran a Kendall rank correlation test for both datasets with the resulting p-values:
| Dataset | p-value | Discussion |
|---|---|---|
| BBS | < 2.2e-16 | or 0.00000000000000022 |
| eBird | < 2.2e-16 |
For both, the p value is less than 0.05 so there is a statistically significant relationship for the number of sites surveyed and the number of Willow Tit records.
The BBS and eBird data show opposite trends, this means there is a bias in the data which requires further statistical analysis. I tried to follow the BBS methodology for modeling populations to produce the R code available in BBSTrendProduction.R, but I do not have the statistical training to verify or interpret the results.
7.3.2 Plots
As a way to compare the datasets, I plotted the 2014-2023 BBS Willow Tit sightings onto a map of the UK and set it beside the eBird map from the earlier chapter (after removing the checklists with no sightings):
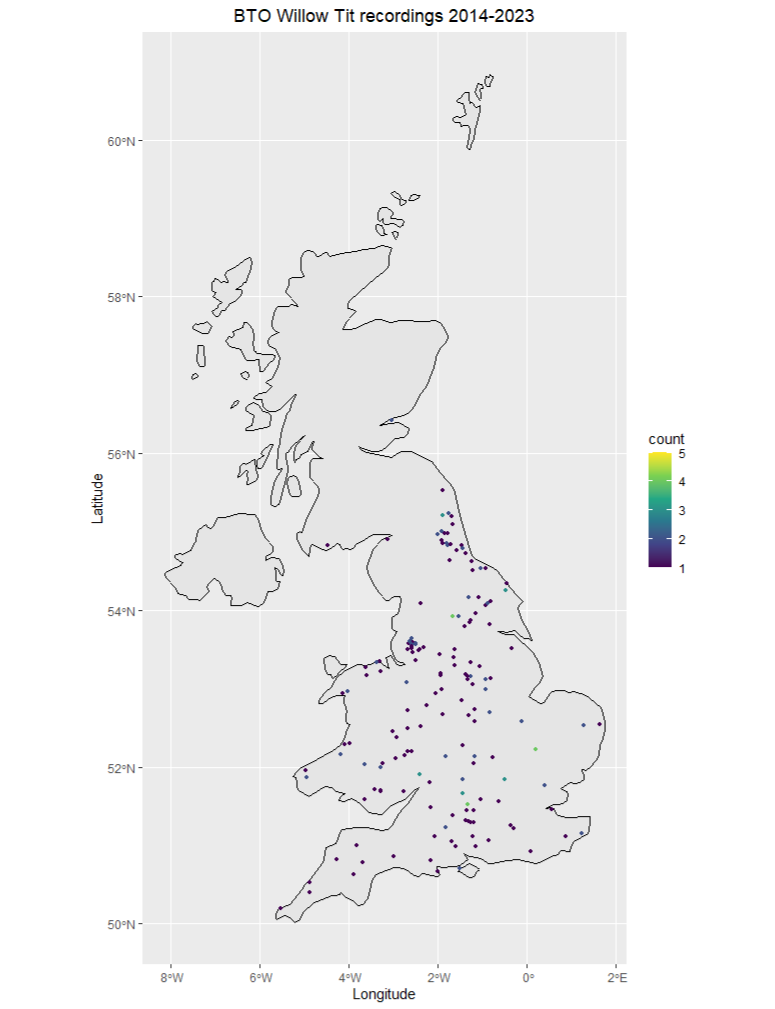
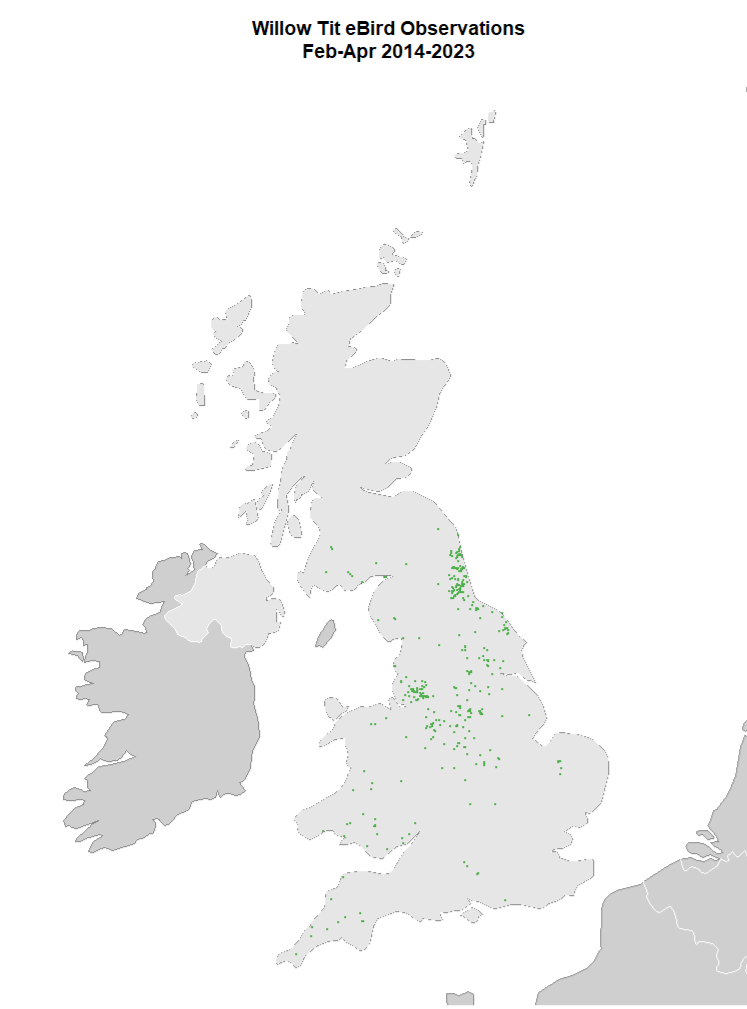
It is clear that the two datasets give a similar picture with populations of Willow Tits occurring in the North East, North West, the midlands, and areas of Wales. More than anything, this may demonstrate the value of eBird as a data source.
7.3.3 Willow Tits in the North West
One point occured to me though. The results from the Willow Tit survey conducted between 2019-2021 Figure 1.2 did not highlight Greater Manchester and the surrounding areas. But according the the Lancashire Wildlife Trust, more than 15% of the UK’s Willow Tits are found in the North West. Over the past few years, the Trust has been running their Wet Willow Wildlife project aimed at improving habitats across Greater Manchester and the surrounding areas. The project is currently ongoing and the data are not publically available.
I thought it would be interesting to plot both the BTO and eBird data on the area surrounding Manchester to see the results. Note, I used all years for the BBS data available as there were fewer data points for the area in total.
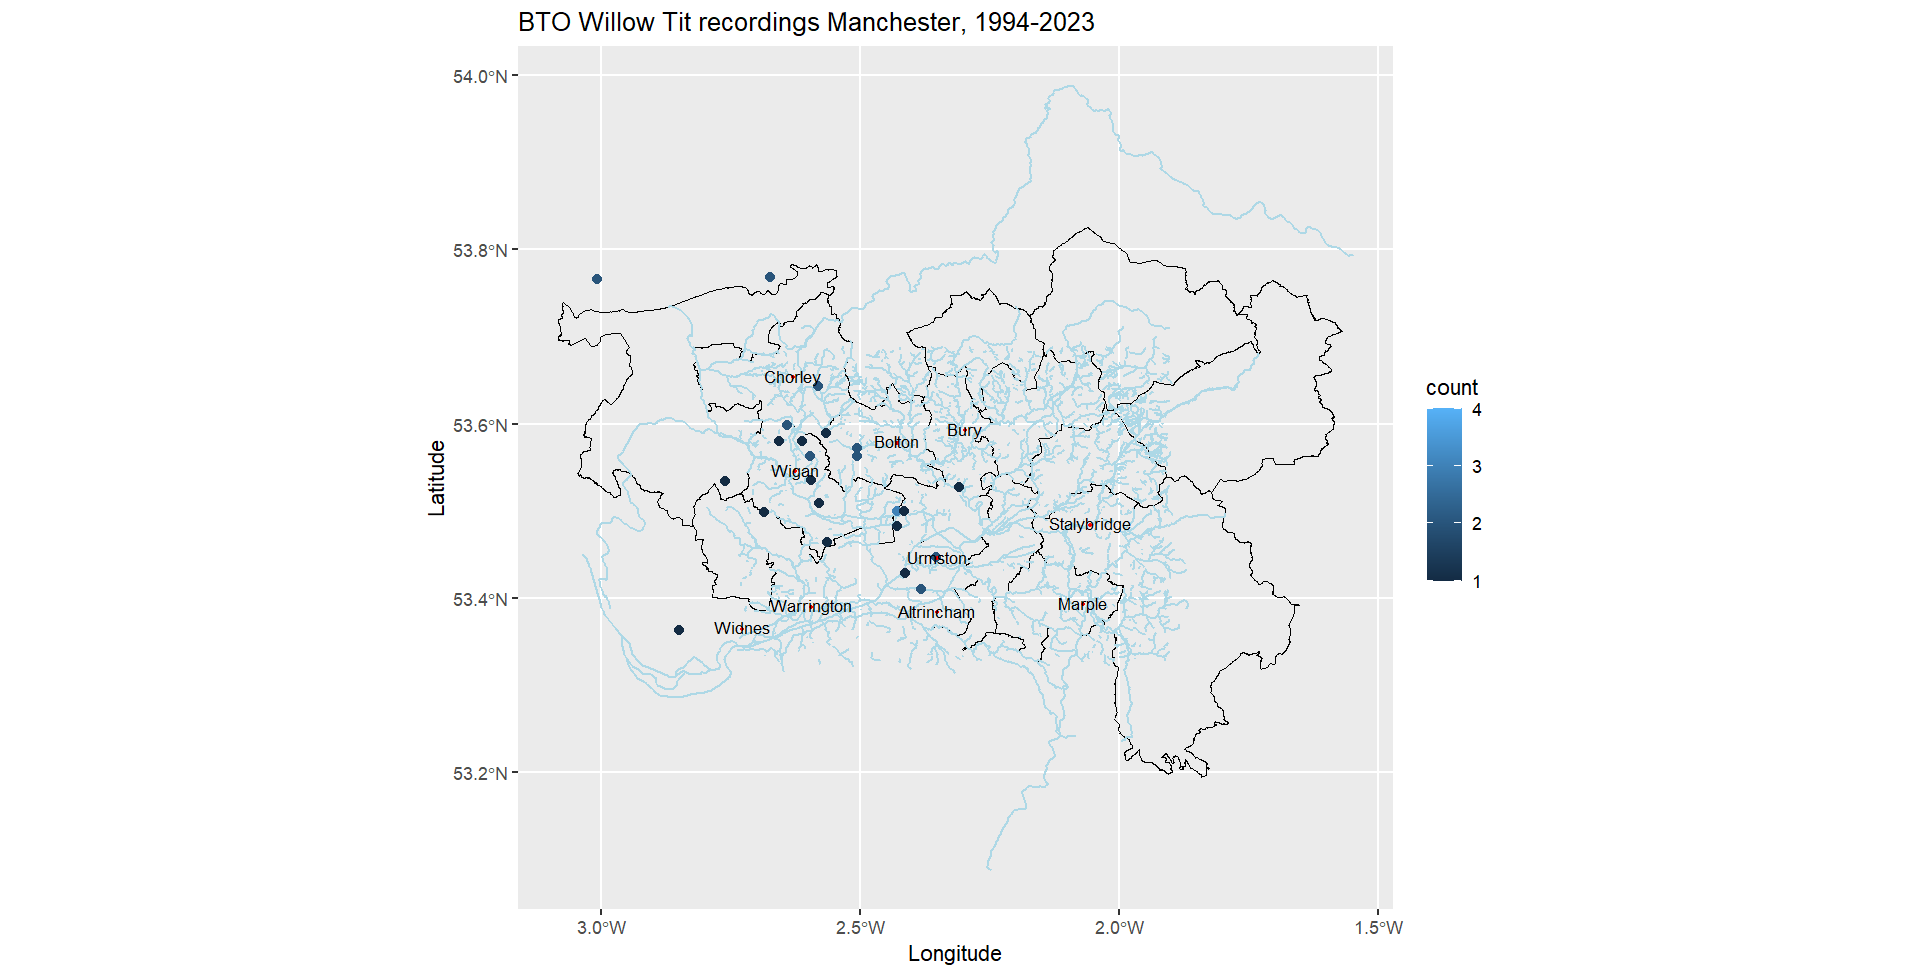
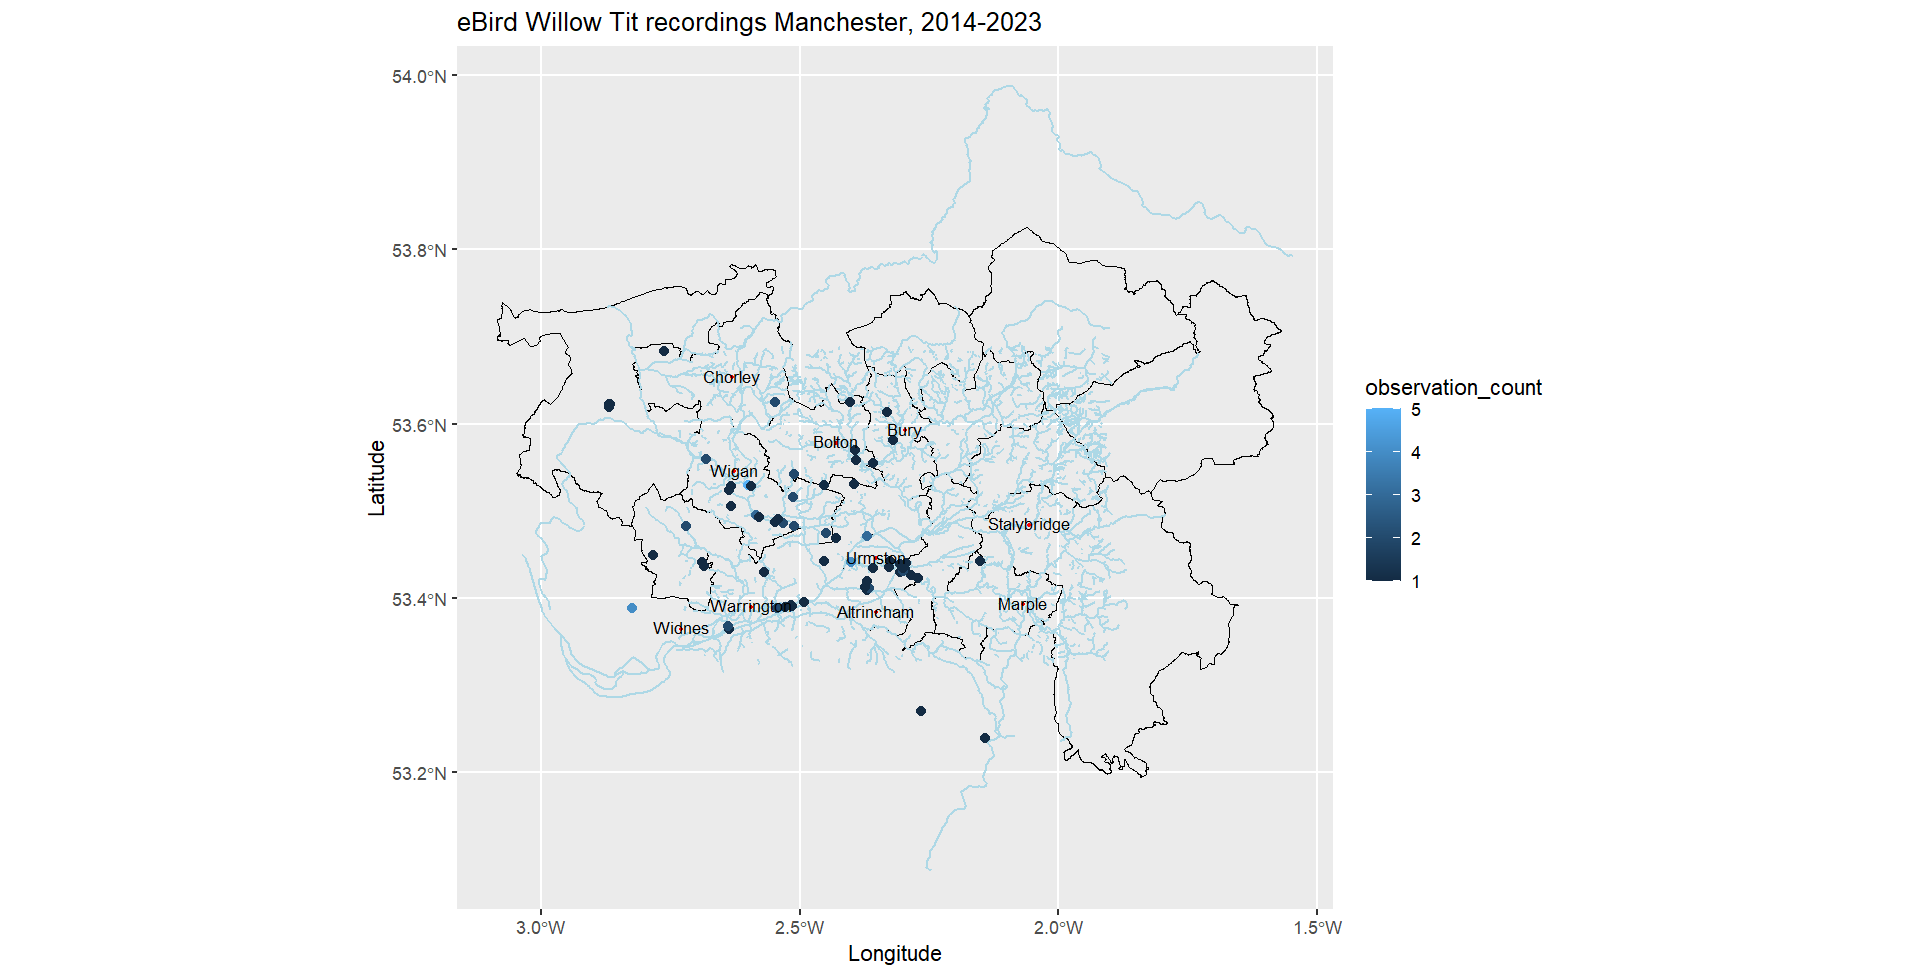
Again, this was an interesting exercise. Not only do both these datasets show that areas around Greater Manchester do have records of Willow Tits, the eBird data added to the BBS picture. The eBird data also revealed more clearly that many of the observations occur on rivers and water features where habitat is idea for Willow Tits. It even indicates that these waterways may function as corridors allowing Willow Tits to move and establish new territories.
7.4 Discussion
I don’t intend to draw many further conclusions from the results of the BBS data. My main goal was to practice mapping the data and setting it beside the eBird data to see how comparable they were and how they could complement one another. I did, however, have some thoughts about the data themselves. Namely that eBird data is as valuable a source of data as more “official” datasets i.e. those that have been well-established and guided by standard protocols. It’s necessary to take into considerations the biases that are inherent in eBird data, but it is equally important not to ignore them.